



Comparison
New Relic vs Dash0: What Survives an OpenTelemetry Migration?
Compare New Relic and Dash0 through async request tracing, metric semantics, profiling boundaries and the operational work behind an OpenTelemetry migration.
Side-by-side product analysis covering setup, workflows, pricing, deployment, and the trade-offs buyers need to verify.
Compare New Relic and Dash0 through async request tracing, metric semantics, profiling boundaries and the operational work behind an OpenTelemetry migration.
Compare New Relic and Elastic Observability through log parsing, request correlation, OpenTelemetry architecture and deployment-specific operational costs.
Compare New Relic and Grafana Cloud from an existing Prometheus estate: application investigation, external data-source responsibilities and current billing inputs.
Compare New Relic and Graylog through log context, parsing, retention, edition boundaries, recovery ownership, and the cost of an investigation handoff.
Compare collection coverage, application context, standalone Linux support, BYOC responsibilities, and total cost through a checkout timeout investigation.
Compare business context, NRQL, BubbleUp, native metrics, sampling, and usage through a report-export failure affecting only some customers.
Compare New Relic and IBM Instana through a delayed incident review: discovery, trace retention, metric resolution, deployment responsibilities, and billing.
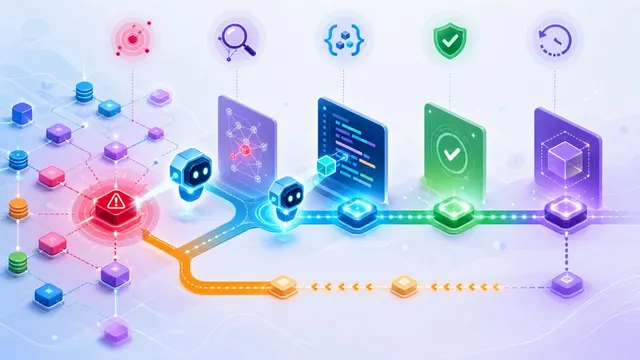
Evaluate observability and incident-response Agents by the data they can access, the investigations they can perform, their tool permissions, and their full operating cost.

Compare log bytes and event counts, searchable retention, archive access, migration work, and three-year operating costs before moving from Datadog to OpenObserve.

Compare retention, event-time handling, SQL and DQL, query capacity, backfill, and ongoing ownership using documented OpenObserve and Guance validation results.

Compare Loki and OpenObserve using recorded query examples, then assess labels, field types, cold queries, retention, and the work of running each backend.

Compare Opik and Phoenix for retrieval investigation, versioned experiments, production scoring, deployment, and evaluator inference costs.